Reshoring, Demand Growth, and Energy Abundance
What happens to economies, AI, and geopolitics when domestic manufacturing and cheap electrons return at the same time.
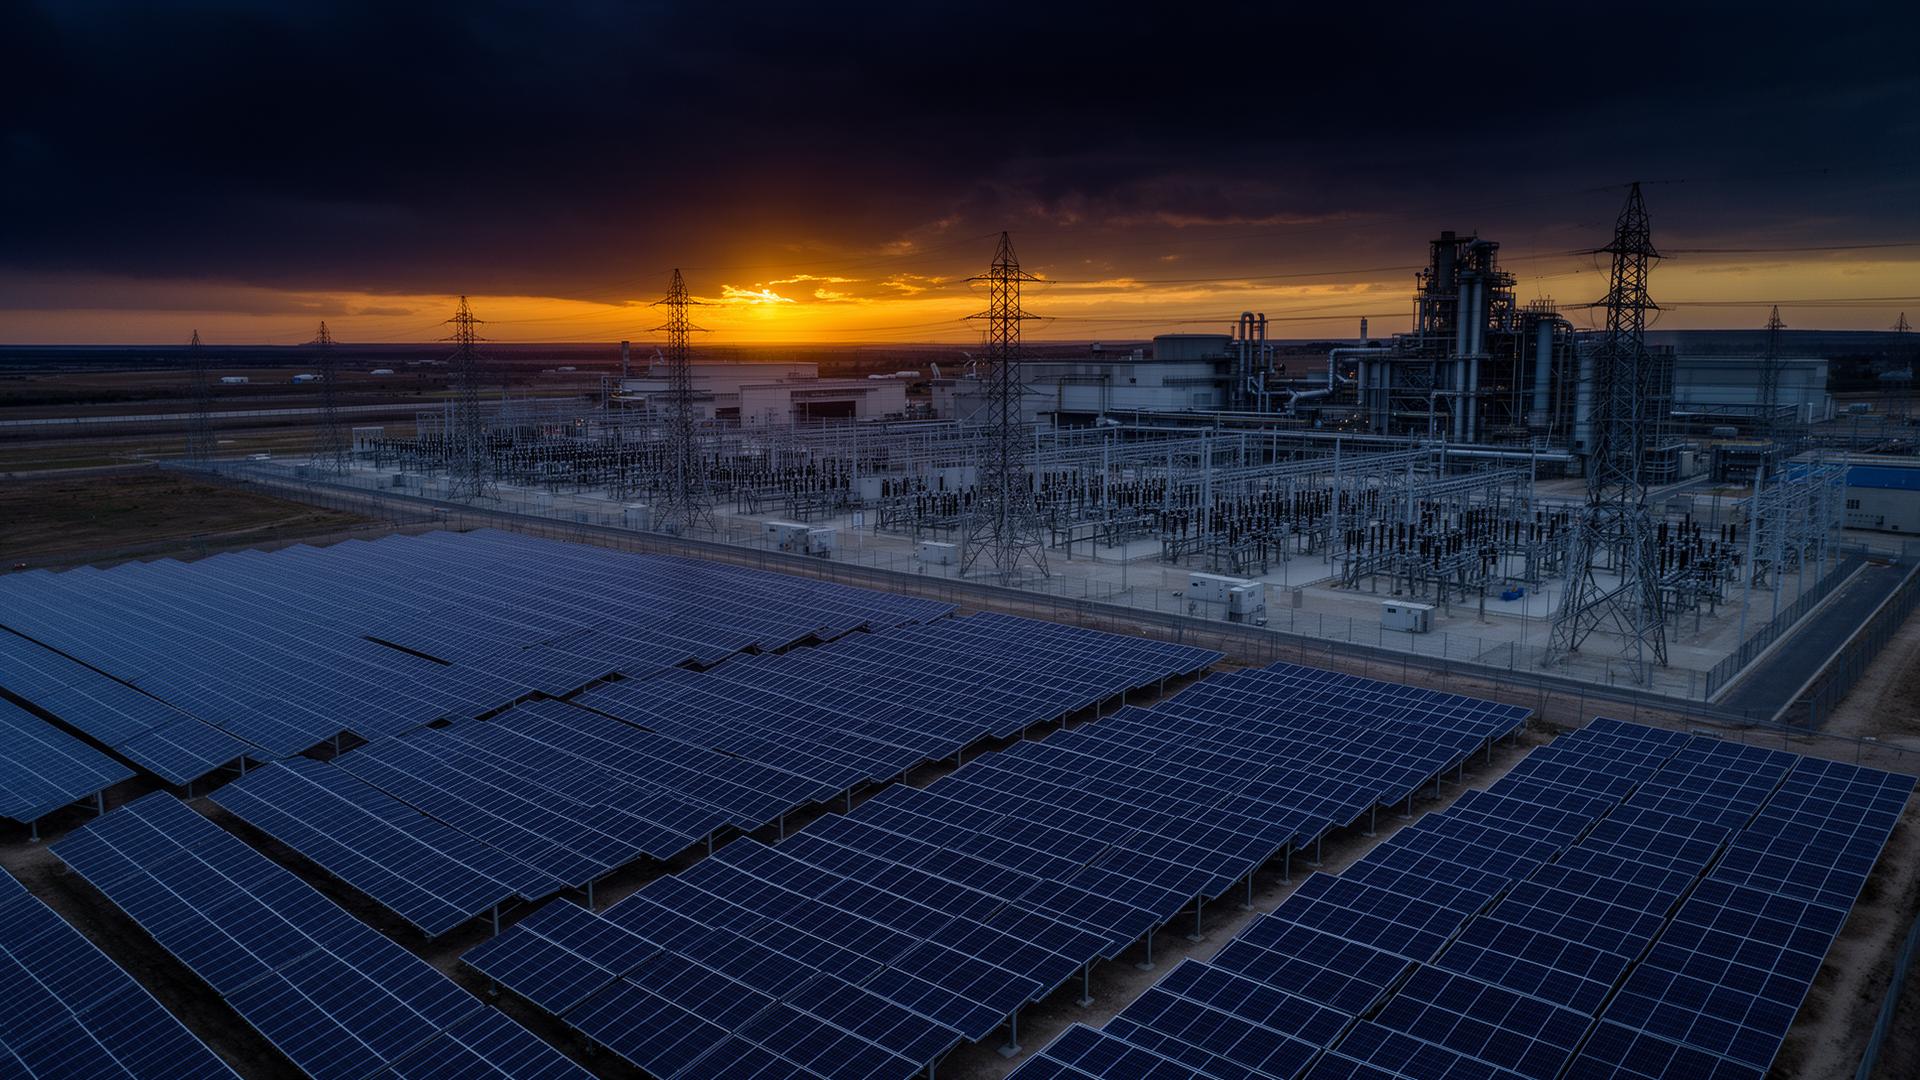
In 1933, the federal government strung transmission lines across the Tennessee Valley and changed the economic geography of the American South. The Tennessee Valley Authority's hydroelectric buildout did not just generate electricity — it reshaped where industry located, which regions grew, and what kinds of work became possible in places that had been bypassed by the industrial economy. Cheap, reliable power was the enabling condition for an industrial transformation that lasted decades.
The mechanism is not complicated: energy-intensive industries follow cheap energy. Aluminum smelting, chemical manufacturing, steel production, and later semiconductor fabrication and data centers have always located where electricity is abundant, reliable, and priced to make the operation competitive. The TVA created that condition in the Southeast. Pacific Northwest hydropower did the same for aluminum smelting. The abundance of cheap natural gas made certain Gulf Coast chemical operations globally competitive.
For roughly the last two decades, that logic was quietly suspended. Electricity demand in developed economies flattened. Manufacturing migrated offshore. The energy-intensive industries that remained in advanced economies increasingly competed on factors other than energy cost — logistics, skilled labor, proximity to customers, intellectual property. The grid became maintenance infrastructure rather than growth infrastructure.
That era is ending. And the dynamics of how it ends will determine a significant portion of the economic geography of the next two decades.
Two Decades of Flattened Demand
The flattening of electricity demand in the United States after 2007 is one of the most consequential and underanalyzed infrastructure trends of the early twenty-first century.
Several forces converged to suppress load growth simultaneously. The LED lighting transition eliminated hundreds of terawatt-hours of annual consumption over fifteen years. Appliance efficiency standards steadily reduced the energy intensity of the building stock. Industrial processes became more efficient. And most significantly: the energy-intensive manufacturing industries that had historically anchored electricity demand migrated to lower-cost production environments offshore.
U.S. electricity demand inflection
Annual U.S. electricity consumption, TWh. Two decades of efficiency-driven stagnation followed by a structural break as AI compute, electrification, and reshored manufacturing layer onto the baseline.
Steel production, aluminum smelting, chemical manufacturing, paper and pulp, and glass production — all electricity-intensive, all economically sensitive to energy cost — shrank as U.S. domestic industries during the period of peak globalization. What replaced them was a service-and-technology economy whose electricity intensity was a fraction of the heavy industrial base it succeeded.
Utilities adapted rationally. Planning models were recalibrated to zero to 0.5 percent annual load growth. Capital programs shifted toward reliability maintenance rather than capacity expansion. The organizational capabilities for managing large load growth — the engineering talent, the supply chain relationships, the regulatory frameworks — atrophied across the industry.
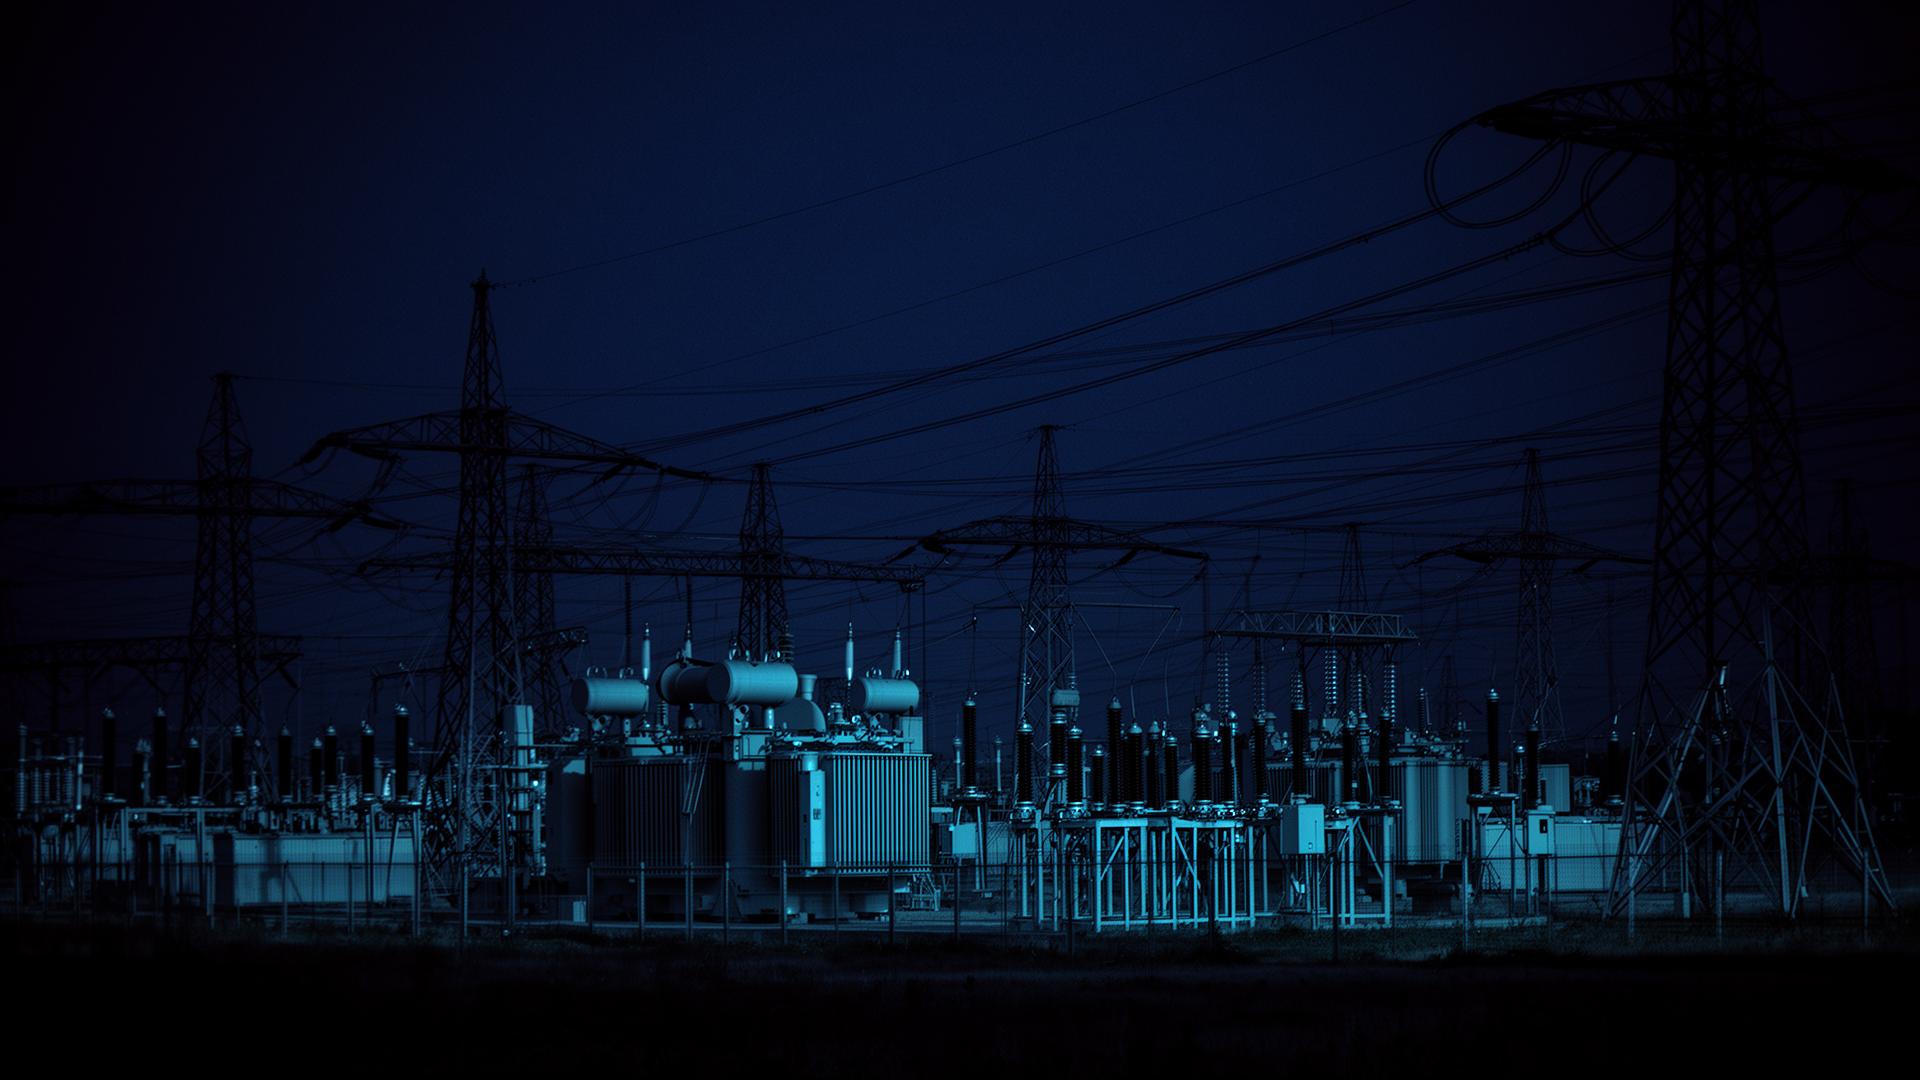
The grid that exists today was designed and maintained around those assumptions. It is now being asked to absorb something structurally different.
The Return of Industrial Load
The demand inflection that is now visible in utility load forecasts is not driven by a single factor. It is the sum of several large structural shifts arriving within the same planning window.
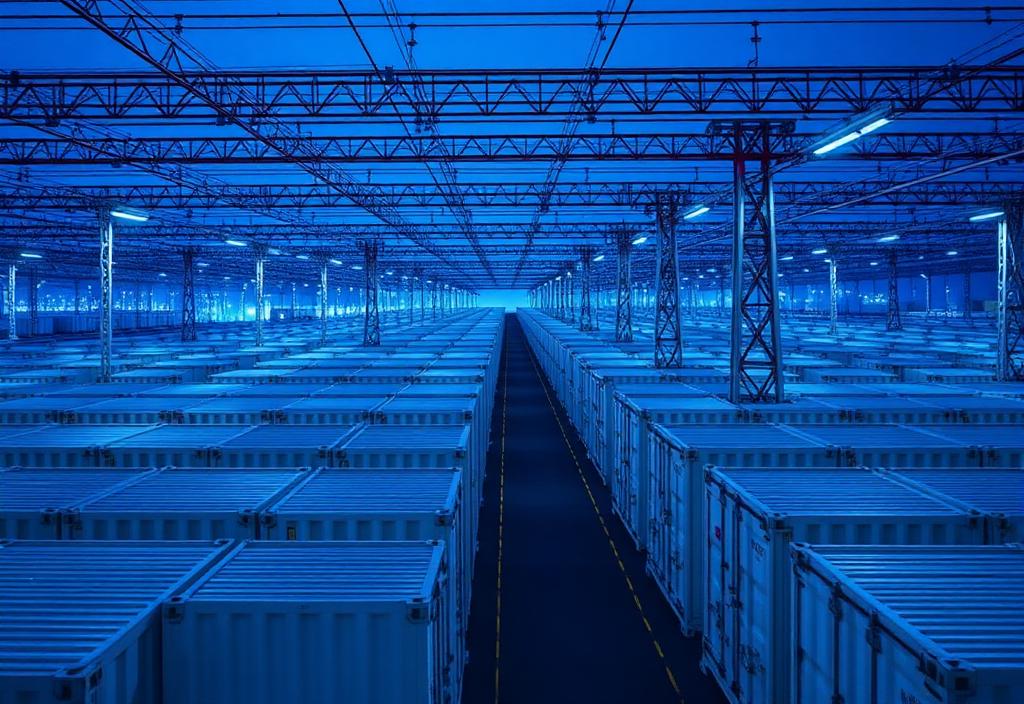
AI compute infrastructure is the most concentrated and fastest-growing load category. A modern large-scale AI training cluster consumes power in the range of 50 to 500 megawatts — continuous, high-utilization, reliability-sensitive load that does not flex with time of day or season. A hyperscale data center campus housing multiple clusters can reach 500 MW to 1 GW of sustained demand. The load profile is unlike any commercial or residential demand category: it runs at 85 to 95 percent utilization factor, around the clock, every day of the year.
The aggregate effect on regional grids is already legible. PJM revised its long-range load forecast upward by more than 40 GW over two years. ERCOT has issued demand projections that represent a step-change from the modest growth trajectories it was planning around as recently as 2021. Dominion Energy in Virginia — the utility serving the world's largest concentration of data center capacity in Northern Virginia — is in a state of near-continuous infrastructure acceleration trying to stay ahead of interconnection requests.
Hyperscale & AI load by ISO/RTO
Projected data center electricity demand by region, GW. 2024 baseline vs. 2030 utility forecasts. PJM and ERCOT lead the absolute revision; Dominion's Northern Virginia footprint dominates per-utility intensity.
Battery and EV manufacturing are reshaping the industrial demand landscape in a different way. A large-format EV battery gigafactory requires 100 to 200 MW of continuous industrial power with stringent power quality requirements — clean, stable voltage and frequency critical for the precision manufacturing processes involved. Semiconductor fabrication facilities require comparable power at even stricter quality standards. These are energy-intensive industries with high value-added output returning to domestic production, and they require utility-scale power infrastructure at their specific geographic locations.
Process electrification is beginning to layer new load onto industrial feeders across the manufacturing belt. Steel minimills converting from natural gas to electric arc furnace operations, chemical facilities replacing combustion-based process heat with induction and resistive heating, food processing operations switching from gas to electric — each represents a substitution of combustion energy demand with electrical demand. Individually, these transitions are incremental. In aggregate, across a manufacturing economy beginning to reshore at scale, they represent the early stages of a structural demand shift.
Heat pumps and building electrification are the distributed equivalent — smaller per-unit load additions that aggregate to significant grid demand across dense residential and commercial geographies, particularly in northern climates as heating electrification displaces natural gas systems.
None of these loads existed at their current scale five years ago. They are additive to the efficiency-adjusted flat-demand baseline. And they are arriving simultaneously.
“Energy-intensive industries follow cheap energy. The mechanism has not changed since the Tennessee Valley Authority strung transmission lines across the American South in 1933. What has changed is the cost of generation.”
Energy Abundance as Economic Infrastructure
The connection between cheap energy and industrial competitiveness is not a new observation. It is one of the most consistent patterns in economic history.
British industrialization was enabled by abundant coal. American mass production was enabled by cheap oil and the interstate highway system as much as by any organizational innovation. The post-WWII German and Japanese industrial recoveries were built on energy infrastructure — both countries made massive investments in energy supply and grid infrastructure as foundational to rebuilding industrial capacity. The Pacific Northwest aluminum industry was, quite literally, a product of hydroelectric abundance.
What is changing now is the cost structure of electricity generation.
Utility-scale solar has crossed a threshold that deserves its own moment of analysis. In 2010, the levelized cost of energy from utility-scale photovoltaic was approximately $300 per megawatt-hour. By 2024, unsubsidized utility-scale solar in high-irradiance regions was delivering power below $25 per megawatt-hour in competitive procurement processes. The decline — more than 90 percent in fourteen years — is one of the largest cost reductions in the history of energy technology.
Solar LCOE & battery cell cost — log scale
Unsubsidized utility-scale solar LCOE ($/MWh) and lithium iron phosphate cell pricing ($/kWh) from 2010 to 2024. The two curves are the cost backbone of the new electricity system.
Battery storage has followed a parallel trajectory. Lithium iron phosphate cells, which have become the dominant chemistry for stationary grid storage, fell from over $1,000 per kilowatt-hour in 2010 to below $100 per kilowatt-hour by 2024. Four-hour battery systems paired with solar generation are increasingly the lowest-cost new-capacity option in competitive markets — not subsidized-lowest-cost, but unsubsidized-lowest-cost.
The combination of cheap solar generation and scalable battery storage creates, for the first time in history, a low-cost electricity resource that is not geographically determined by hydrology, coal geology, or natural gas pipeline access. Any location with adequate solar irradiance can access commodity-cost electricity at scale if it has transmission infrastructure and land. The Southwest United States, northern Chile, the MENA region, northern India, and Sub-Saharan Africa all qualify by resource metrics.
This is not a marginal improvement. It is a restructuring of the geography of energy cost.
Regions that were previously constrained to expensive electricity — because they lacked domestic fossil fuel resources, had poor hydrology, or faced high import costs — can now access cheap generation through solar. Regions that already had cheap electricity can potentially make it even cheaper by adding solar to a grid with existing baseload infrastructure. The distributional implications for industrial competitiveness are large and underappreciated.
The Solar and Storage Inflection
The physical performance characteristics of the solar-plus-storage system that is becoming standard utility infrastructure merit some specificity, because the economics follow from the engineering.
A utility-scale solar facility today is not the fixed-tilt, single-axis tracker that defined the industry a decade ago. Modern utility-scale facilities use single-axis horizontal trackers with bifacial modules, capturing reflected irradiance from the back surface in addition to direct irradiance on the front. Effective capacity factors at premium sites in the Southwest now exceed 30 percent at AC rating, with some exceptional sites approaching 35 percent. These are not theoretical; they are contractual performance guarantees being written into PPAs today.
Paired battery storage has evolved from a supplementary product to an operationally integrated component of the plant design. Four-hour lithium iron phosphate systems — 1 MW of storage capacity for every 1 MW of solar AC capacity, with 4 MWh of energy — have become the standard configuration for capacity market participation. The battery system charges during the midday solar surplus, discharges into the evening peak, and enables the plant to provide firm capacity across the most critical reliability hours of the dispatch day.
Eight-hour systems are the emerging standard for markets with deeper duck curve profiles and longer evening peaks. The cost structure of longer duration is not linear: power electronics, substation equipment, and site infrastructure scale with power capacity, not energy capacity. Doubling duration roughly doubles battery cost but does not double total project cost. The capacity value of an eight-hour system — able to discharge continuously through an evening peak without recharging — commands higher capacity payments in accreditation-based markets and enables firmer contracted positions.
The operational implication for electricity markets is significant: solar-plus-storage with eight-hour duration can, in high-solar regions, displace firm gas peaking capacity on an economic basis without relying on fuel price volatility assumptions. The gas peaker's advantage — firm, dispatchable power at any time — erodes when the competing technology can deliver 8 hours of continuous firm dispatch at lower variable cost and zero fuel price risk.
Curtailment is the system-level signal that generation is now abundant in the regions where solar has been most heavily deployed. CAISO curtailing 3+ million MWh annually means that the generation capacity exists and is being built, but the transmission infrastructure to deliver that generation to load is the binding constraint. This is an important distinction: curtailment is not evidence that solar economics are weak. It is evidence that transmission has not kept pace with generation deployment.
AI as an Industrial Load Category
The data center industry has been characterized, in most utility planning analysis, as a commercial load — subject to similar planning assumptions as office buildings, retail facilities, and commercial campuses. This characterization is no longer adequate.
Modern AI training and inference infrastructure operates at a scale and load profile that has more in common with heavy industry than with commercial real estate. The power demand of a 100 MW AI training cluster is continuous, non-curtailable, and reliability-sensitive in ways that office buildings are not. A two-hour power outage that a commercial building absorbs with minor inconvenience can cost an AI operator millions of dollars in lost computation, corrupted training runs, or inference service interruptions that violate contractual SLAs.
Industrial electricity intensity by sector
Approximate electricity consumption, MWh per $1M of output. AI data centers and semiconductor fabs sit at the top of the modern industrial intensity stack — alongside aluminum and primary steel.
The load factor of hyperscale AI infrastructure — 85 to 95 percent utilization, continuously — is comparable to the load factor of a steel mill or an aluminum smelter. These are industrial-intensity electricity consumers that happen to produce computation rather than metal.
The geographic distribution of AI infrastructure is not random. It concentrates where several conditions coexist: available transmission capacity, access to low-latency fiber networks, an engineering labor market, supportive utility and regulatory environments, and increasingly, access to low-cost power. Northern Virginia developed as the world's largest data center market in part because Dominion Energy's historically abundant capacity and relatively low rates created favorable conditions. The risk that those conditions are now being exhausted — Dominion is building at multi-decade-high capital expenditure rates and still faces interconnection queue backlogs — is accelerating geographic diversification of hyperscale investment toward Texas, Georgia, Arizona, and the Mountain West.
The regions that can offer 500 MW interconnections within 24-month timelines and long-term power at competitive rates are competing for a category of industrial investment with compounding economic effects. Data centers create high-paying technical employment, generate significant tax revenue, create local service economy demand, and in many cases anchor additional technology investment in their surrounding regions. The utility that can serve them, and the transmission system that can deliver the power, are not peripheral infrastructure. They are the enabling condition for a significant portion of twenty-first-century economic development.
“The regions that can offer 500 MW interconnections within 24-month timelines and long-term power at competitive rates are competing for a category of industrial investment with compounding economic effects.”
The Geography of the Next Economy
Energy geography is re-emerging as an economic determinant after a decades-long period when it seemed to have been superseded by logistics, labor, and capital mobility.
The mechanism is direct: energy-intensive activities locate where electricity is abundant and cheap. AI clusters, semiconductor fabrication, electrolytic hydrogen production, aluminum smelting, and electric arc steel production all share the characteristic that electricity is their largest or among their largest operating costs. A 10 percent difference in electricity cost at a 500 MW data center represents tens of millions of dollars in annual operating expense. At a 200 MW semiconductor fab, the electricity cost differential between a high-priced and low-priced market can determine whether domestic production is globally competitive.
Reshoring corridors & energy geography
Announced semiconductor, EV, and battery investment is concentrating in energy-advantaged states — Sun Belt solar, Plains wind, TVA & Southern Company corridors, and Mountain West hyperscale clusters.
Several U.S. regions are positioned to benefit from the convergence of renewable abundance and industrial reshoring:
Texas has built more wind capacity than any other state and is developing solar at scale. ERCOT's nodal market structure produces some of the lowest wholesale electricity prices in the country during high-generation periods. Texas also benefits from land availability, a supportive regulatory environment for infrastructure development, a large industrial base, and port access. The risk — ERCOT's isolation and the reliability questions raised by the February 2021 grid failure — is real and requires continued infrastructure investment.
Arizona and Nevada are among the highest-irradiance states in the country, with land availability and transmission access to Western load centers. Both states are seeing significant semiconductor and EV manufacturing investment — investments that were explicitly cited as influenced by electricity access in site selection analyses.
The Southeast manufacturing corridor — from Tennessee through Georgia, the Carolinas, and into Alabama — has historically benefited from relatively low electricity rates from TVA, Southern Company, and Duke Energy. The convergence of manufacturing reshoring (EV plants, battery facilities, semiconductor investment) with the existing industrial base is creating a regional economic dynamic with significant grid infrastructure implications.
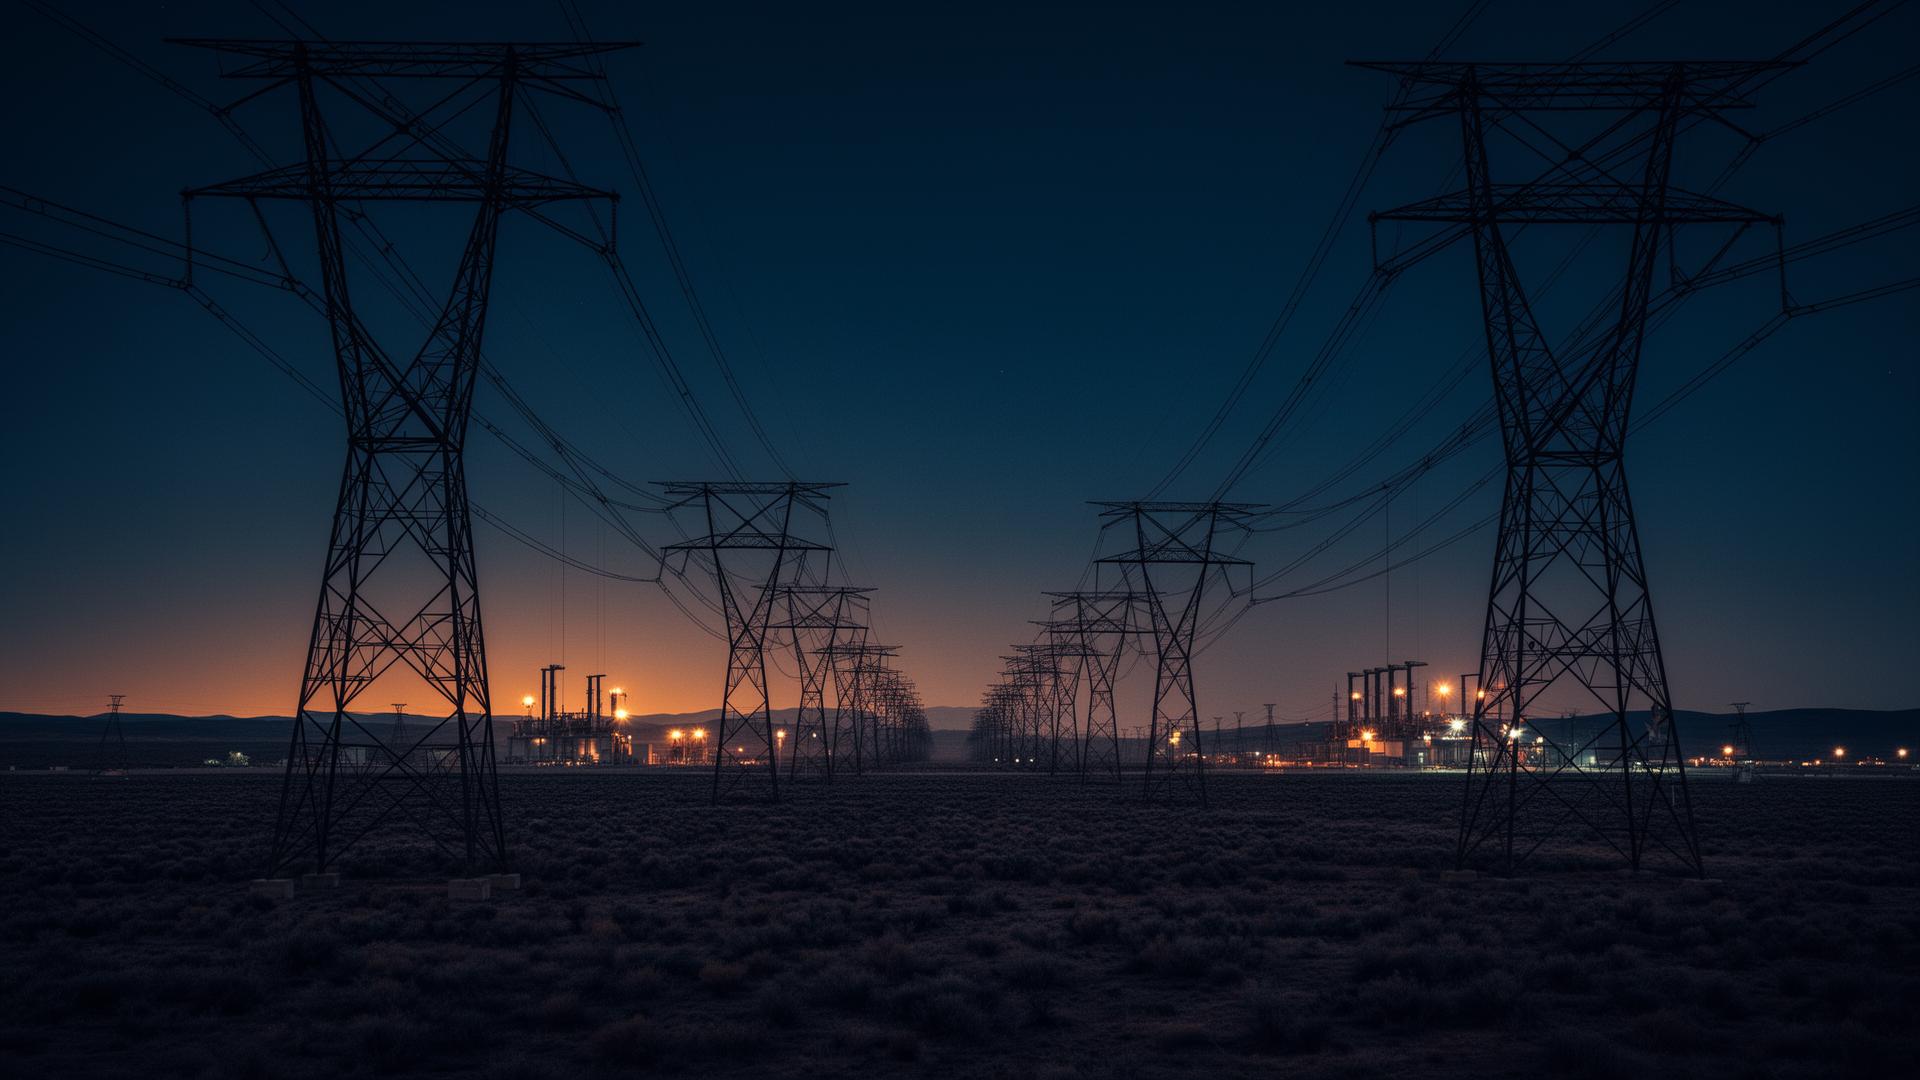
The Midwest wind belt — Iowa, Kansas, Nebraska, Oklahoma, and the Dakotas — has extraordinary wind resources that are currently stranded by inadequate transmission to eastern and coastal load centers. Transmission buildout in this region has transformative potential: it would reduce curtailment, lower electricity costs in receiving regions, and create the conditions for energy-intensive industrial investment in areas that have faced decades of economic dislocation from manufacturing migration.
The geography of energy abundance will not automatically translate into economic advantage. It requires the transmission infrastructure to deliver that energy to load, the distribution infrastructure to serve industrial customers, the regulatory frameworks to enable rapid interconnection, and the utility execution capacity to actually build the physical systems required.
The Bottlenecks
The thesis of energy abundance driving industrial expansion has a necessary qualifier: the abundance must be deliverable.
The interconnection queue holding 2,600+ GW of proposed generation demonstrates that the generation investment appetite exists and is substantial. What the queue also demonstrates is that the transmission system cannot absorb that generation on any timeline that matches the generation investment pipeline.
U.S. interconnection queue backlog
Total active capacity in U.S. ISO/RTO queues, GW. Historical project completion rates have hovered near 25 percent — the queue is a measure of unmet transmission, not built capacity.
Transformer shortages are a physical constraint that no amount of capital can immediately resolve. Large power transformers — the equipment that steps voltage up and down at substations and interconnection points — are engineered-to-order products with manufacturing concentrated in a small number of global facilities. Lead times of 24 to 42 months for large units are now standard; some specialized equipment is quoting beyond three years. The domestic U.S. transformer manufacturing base is a fraction of what demand requires. Building new manufacturing capacity for transformers requires its own multi-year development cycle.
Transmission siting is an institutional constraint that reflects the political geography of infrastructure development. An HVDC line crossing five states must navigate five separate regulatory proceedings, each capable of imposing delays or conditions that affect the entire project. There is no federal transmission siting authority comparable to what exists for natural gas pipelines. Projects that are clearly in the national interest — connecting stranded Great Plains wind to eastern load centers, for example — can be blocked by local opposition in a single county or denied by a single state utility commission.
Permitting timelines create a pacing constraint that applies across the entire infrastructure stack. Distribution upgrades require local permits. Substation expansions require environmental review. Transmission projects require multi-agency coordination. The aggregate timeline from planning to energization for major grid infrastructure is measured in years to decades, while the economic need is measured in months.
Labor shortages are real and worsening. Journeyman lineworkers, substation electricians, protection engineers, and cable splicers are in short supply across most utility service territories. The craft workforce that built the existing grid is aging; the pipeline of trained replacements is insufficient for a rapid expansion cycle. Apprenticeship programs that take three to five years to produce qualified journeymen cannot be accelerated by capital investment alone.
Utility capex cycle constraints mean that even utilities that understand the investment required and have regulatory approval to recover the costs face organizational limits on execution speed. Engineering departments that were sized for slow-growth environments cannot immediately expand to manage three to five times their historical capital program. Project management capacity, contractor relationships, and procurement systems all take time to scale.
Major investor-owned utility capex
Aggregate U.S. IOU capital expenditure programs, $ billions. Investment is at multi-decade highs and still trailing the load growth pace.
These are not arguments against the energy abundance thesis. They are the infrastructure deployment timeline that shapes when and where that abundance materializes. The regions and organizations that navigate these constraints most effectively will capture the economic advantages of energy abundance earliest.
The Strategic Consequences
The strategic implications of an energy abundance inflection extend well beyond utility economics.
Industrial competitiveness in energy-intensive sectors is increasingly determined by electricity cost and reliability rather than labor cost alone. As wage convergence between developed and developing economies has reduced the labor arbitrage advantage that drove offshoring, electricity cost has become a more prominent factor in industrial location decisions. A U.S. aluminum smelter operating at $30/MWh average cost can compete with overseas production in ways that a smelter at $80/MWh cannot.
AI leadership is partly an energy infrastructure question. The countries and regions that can provide reliable, abundant, low-cost power to large-scale compute infrastructure will attract AI investment. The competition for hyperscale data center development between U.S. states, between the U.S. and Europe, and between advanced economies and lower-cost developing markets is, in significant part, a competition for electricity supply. Energy infrastructure policy is AI industrial policy, whether it is framed that way or not.
Energy security has re-emerged as a geopolitical priority following the disruptions of the 2021–2022 energy crisis. Countries that depend on imported fossil fuels face vulnerability that domestic renewable development directly addresses. The economics of solar and storage now support domestic energy production in most world regions. The build-or-buy decision for energy supply has tilted toward build in ways that have geopolitical implications for both exporters and importers of fossil fuels.
Regional inequality within the United States is partially an energy geography question. Regions with abundant renewable resources — the Great Plains, the Southwest, parts of the Southeast — have the potential to attract energy-intensive investment that has historically concentrated in coastal economic centers. Whether that potential is realized depends on transmission buildout, regulatory frameworks, and industrial policy. The TVA precedent is instructive: deliberate infrastructure investment in a resource-abundant but economically lagging region can reshape its economic trajectory over decades.
Capital allocation is beginning to reflect energy geography in ways that were not visible five years ago. Infrastructure investors, industrial companies making plant siting decisions, and hyperscale operators choosing data center locations are all weighting electricity cost, reliability, and transmission access more heavily in their decision frameworks. The regions that cannot demonstrate adequate power supply on relevant development timelines are being passed over. This is a capital allocation signal that compounds over time — the first investments attract subsequent investments, the infrastructure improves, and the economic advantage widens.
The Physical Infrastructure Is the Economic Policy
One of the clearest lessons from the history of industrial development is that infrastructure is not background to economic growth — it is the substrate on which economic growth happens.
The railroads did not serve an existing freight economy. They created the conditions for a freight economy that could not have existed without them. The interstate highway system did not serve an existing suburban economy. It created the suburban economy by making land that was previously inaccessible economically viable. TVA hydropower did not serve an existing industrial base in the Tennessee Valley. It attracted an industrial base that the resource made possible.
The grid infrastructure being built — or failing to be built — over the next two decades will function the same way. Transmission lines that connect stranded renewables to industrial corridors will determine whether those corridors develop at all. Substation capacity that enables rapid interconnection of large industrial loads will determine which regions attract semiconductor fabs, battery gigafactories, and AI campuses. Distribution modernization that can handle EV fleet charging will determine which cities can support electrified logistics operations.
These are not secondary or supportive investments. They are the primary enabling condition for the next industrial cycle.
The policy implication is direct: energy infrastructure investment is industrial policy. The countries and regions that treat grid buildout as a core economic strategy — allocating capital, streamlining permitting, developing workforce pipelines, and building the regulatory frameworks for rapid deployment — are making a bet on their position in the next industrial order. The countries and regions that treat grid buildout as an afterthought will discover, some years from now, that the economic activities they wanted to host went somewhere else.
“The countries and regions that treat grid buildout as a core economic strategy are making a bet on their position in the next industrial order. The countries that treat it as an afterthought will discover that the economic activities they wanted to host went somewhere else.”
Conclusion
The next economic cycle may look more like the mid-twentieth century than the early twenty-first.
The early twenty-first century economic model was built on software leverage, financial engineering, and global supply chains with cheap labor as the primary input. Physical infrastructure was managed rather than built. Energy was a cost to be minimized through efficiency rather than a resource to be developed for competitive advantage.
What is emerging is something different. The physical economy is re-asserting itself. Compute infrastructure requires electricity. Manufacturing requires energy. Transportation electrification requires grid capacity. Industrial reshoring requires power. And the AI systems that are being presented as the next platform for economic productivity require more electricity per unit of useful output than any commercial technology category that has preceded them.
The result is a world where the physical ability to generate, transmit, store, and deliver electricity at large scale is becoming one of the most strategically consequential capabilities an economy can develop.
The solar revolution has already happened. The cost of generating electricity from sunlight is now competitive with any alternative in most of the world, without subsidy, at utility scale. The battery storage revolution is happening now. The transmission buildout is beginning, slowly and with substantial institutional friction.
The regions that can accelerate the physical infrastructure — the substations, transmission lines, distribution feeders, transformer supply chains, and grid software systems — are positioning themselves at the center of the next industrial order.
The countries and regions that treat energy infrastructure as a peripheral concern will find, years from now, that energy abundance was the competitive advantage that mattered most — and that they built it too slowly to capture what it made possible.
The electrons are available. The question is whether the infrastructure to deliver them will be built fast enough, in the right places, to enable the industrial economy that the abundance of cheap, clean power makes possible.
That is the central infrastructure question of the next two decades. It is also, more than any technology or policy question, the central economic question.
Photo Volt Media's editorial desk publishes long-form theses on the macro infrastructure of the energy buildout — generation economics, industrial demand, transmission geography, and the policy frameworks shaping the next industrial cycle.
Related analysis.
HVDC Corridors and the Stranded-Renewables Problem
Wind in the plains, solar in the desert, load on the coasts. Why long-distance transmission is the bottleneck of the decade.
Inside the Interconnection Queue Crisis
2,600 GW is waiting to plug in. Hyperscale data centers are pulling forward a transmission problem.
Battery Storage Is Becoming Grid Infrastructure
From peakers to firming: 4-hour BESS systems are restructuring capacity markets and ancillary services.
The Earth Receives 173,000 Terawatts of Solar Energy
The bottleneck has never been the fuel. It's always been the infrastructure.