
The Electrification Era Is Just Beginning
EVs, heat pumps, and industrial process electrification are quietly doubling the relevance of the distribution grid.
For roughly two decades, U.S. electricity demand barely moved. Between 2007 and 2022, total annual consumption declined slightly in most years, held flat in others, and never meaningfully exceeded the 2007 peak for any sustained period. LED lighting, more efficient appliances, deindustrialization, and slower economic growth neutralized the load growth utilities had spent a century planning around.
Utilities responded rationally. They optimized for a slow-growth environment. Distribution planning cycles stretched. Capital expenditure programs focused on reliability maintenance rather than capacity expansion. Planning assumptions built around 0 to 0.5 percent annual load growth became standard. A generation of utility engineers built careers around a relatively stable demand picture.
That era is ending.
Electric vehicles, heat pumps, industrial electrification, reshored manufacturing, and AI infrastructure are beginning to layer new, sustained load onto a distribution system that has not been seriously expanded in decades. The load growth coming at the U.S. grid is not incremental. It is structural — driven by the replacement of combustion infrastructure with electrical infrastructure at economy-wide scale.
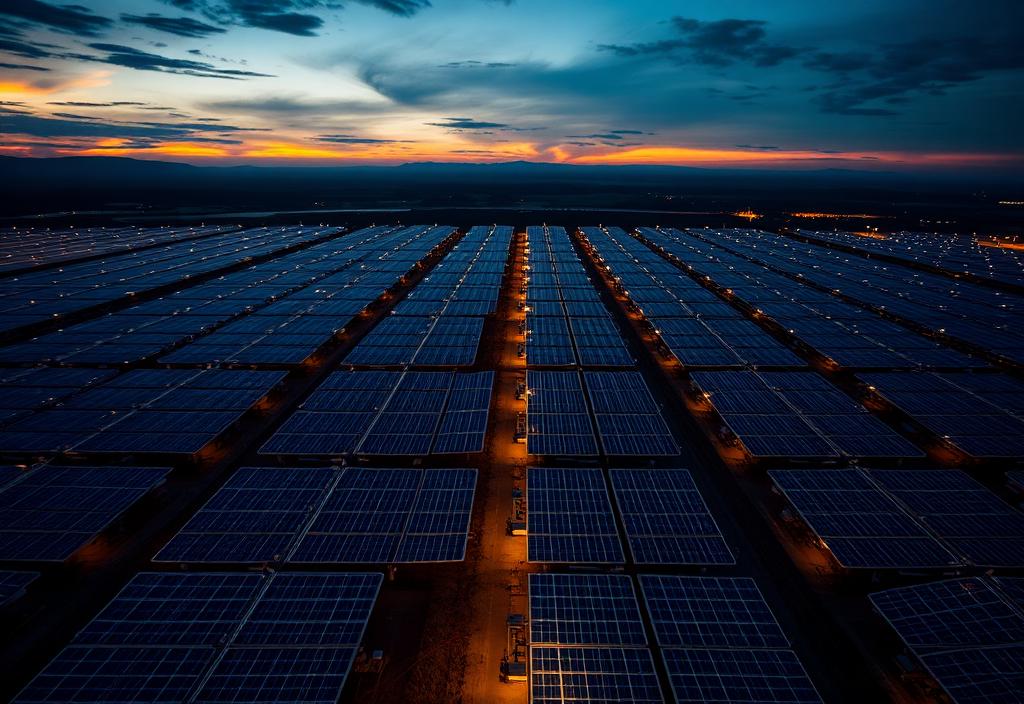
And the bottleneck is not solar panels or wind turbines. The bottleneck is wires, transformers, substations, feeders, and the local grid infrastructure that most energy commentary ignores entirely.
U.S. electricity demand: the inflection
Annual end-use consumption, TWh. Two decades of engineered stagnation give way to structural growth driven by EVs, heating electrification, AI, and reshored industry.
Two Decades of Engineered Stagnation
The flattening of electricity demand after 2007 was not an accident. It was the predictable result of several overlapping efficiency revolutions arriving simultaneously.
Compact fluorescent and then LED lighting displaced incandescent bulbs at a pace that eliminated roughly 200 to 300 terawatt-hours of annual consumption over fifteen years — the equivalent of taking dozens of large power plants offline. Refrigerators, HVAC systems, and industrial motors all improved dramatically in efficiency. The ENERGY STAR program, building codes, and equipment efficiency standards continuously ratcheted down the energy intensity of the building stock.
Manufacturing, meanwhile, left. U.S. industrial electricity consumption fell sharply through the 2000s as heavy manufacturing capacity relocated offshore. Steel, aluminum, chemicals, and electronics fabrication — among the most electricity-intensive industries in existence — shrank as domestic operations. The regional grids built to serve them retained the capacity; the loads departed.
The result was a utility industry that structurally adapted to low growth. Long-range planning models were calibrated to nearly flat demand. Distribution investment was directed toward aging infrastructure replacement rather than new capacity. In many service territories, utilities fought regulatory battles against new commercial and industrial loads precisely because those loads could strain infrastructure that hadn't been expanded in decades.
This is the baseline the electrification era is landing on.
The Return of Load Growth
The loads coming back to the grid are not simply replacing what left. They are new categories of demand with different temporal profiles, geographic distributions, and infrastructure requirements.
Electric vehicles are the most widely discussed driver, but fleet and depot electrification may matter more to the distribution grid than personal vehicles. A single electric transit bus depot with 50 to 100 buses charging overnight can require 2 to 5 MW of new load at a single point of interconnection — equivalent to adding a small neighborhood's worth of demand to a single distribution feeder. A fleet operator electrifying 500 delivery vehicles across multiple depots in a metro area can generate distribution upgrade requirements across dozens of substations simultaneously.
Heat pumps are rerouting the energy that residential and commercial buildings previously drew from natural gas pipelines through the electrical system instead. In a mild climate, this transition is efficient and load-managed. In northern climates with sustained cold periods, cold-climate heat pumps drawing 2 to 5 kW per home, multiplied across a densely electrified neighborhood, can create coincident winter evening peaks that northeastern and Midwestern utilities have not historically planned for.
Industrial electrification is reshaping demand at the multi-megawatt scale. Process heat — the largest single category of industrial energy use — is increasingly addressable by induction heating, electric arc furnaces, and direct electrification technologies that were uneconomic a decade ago. A steel minimill converting from natural gas to electric arc, or a chemical facility replacing steam cracking with electric-driven alternatives, can add 50 to 200 MW of sustained industrial load in a single project.
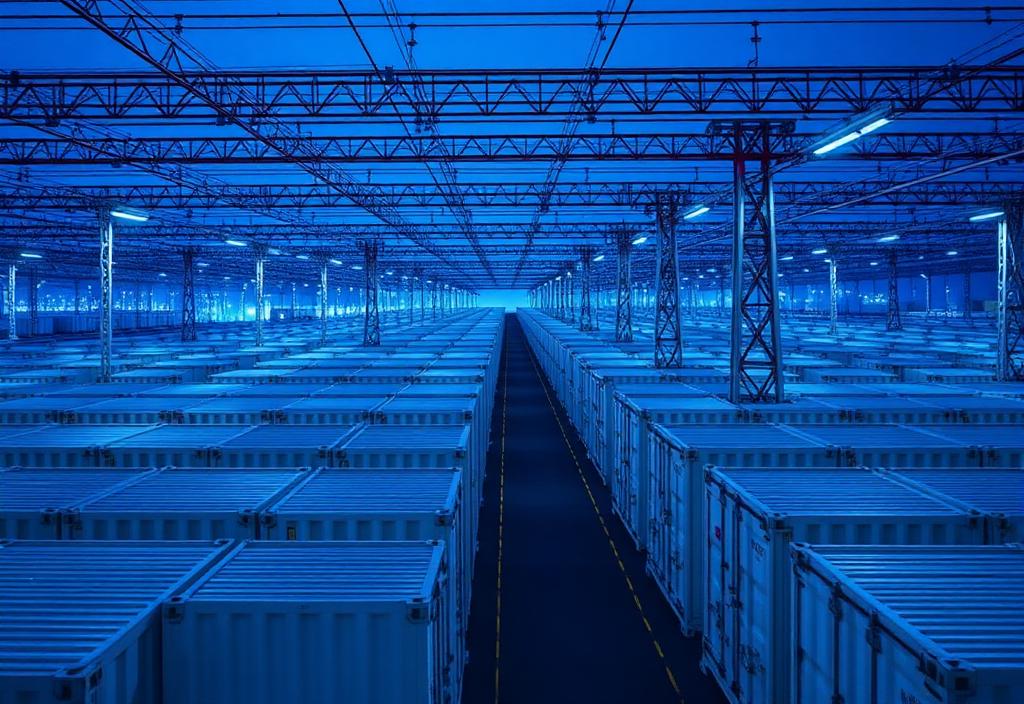
AI data centers represent the most concentrated and rapidly growing load category. A single hyperscale campus at 500 MW continuous draw, operating at 90 percent load factor year-round, generates roughly 3.9 terawatt-hours of annual consumption — comparable to a small city. Northern Virginia, the world's largest data center market, has watched Dominion Energy attempt to plan around load growth that is doubling within a single rate case cycle.
These loads are additive. They do not offset each other. And many are coincident — EV charging, heat pump demand, and commercial electrification all tend to peak during the same evening hours in winter months, stacking onto a peak that the distribution system must be sized to serve.
Electrification load growth by sector
Incremental U.S. peak demand additions, GW, by driver. EVs, heat pumps, AI/data centers, industrial electrification, and reshored manufacturing stack additively through 2035.
“The bottleneck is not solar panels or wind turbines. It is wires, transformers, substations, and feeders — the local grid infrastructure that most energy commentary ignores entirely.”
The Distribution Grid Problem
Most public discussion of the energy transition focuses on generation — solar farms, wind parks, battery systems, gas plants. The grid architecture required to deliver that generation to where it is needed receives far less attention. This is an error in the infrastructure analysis.
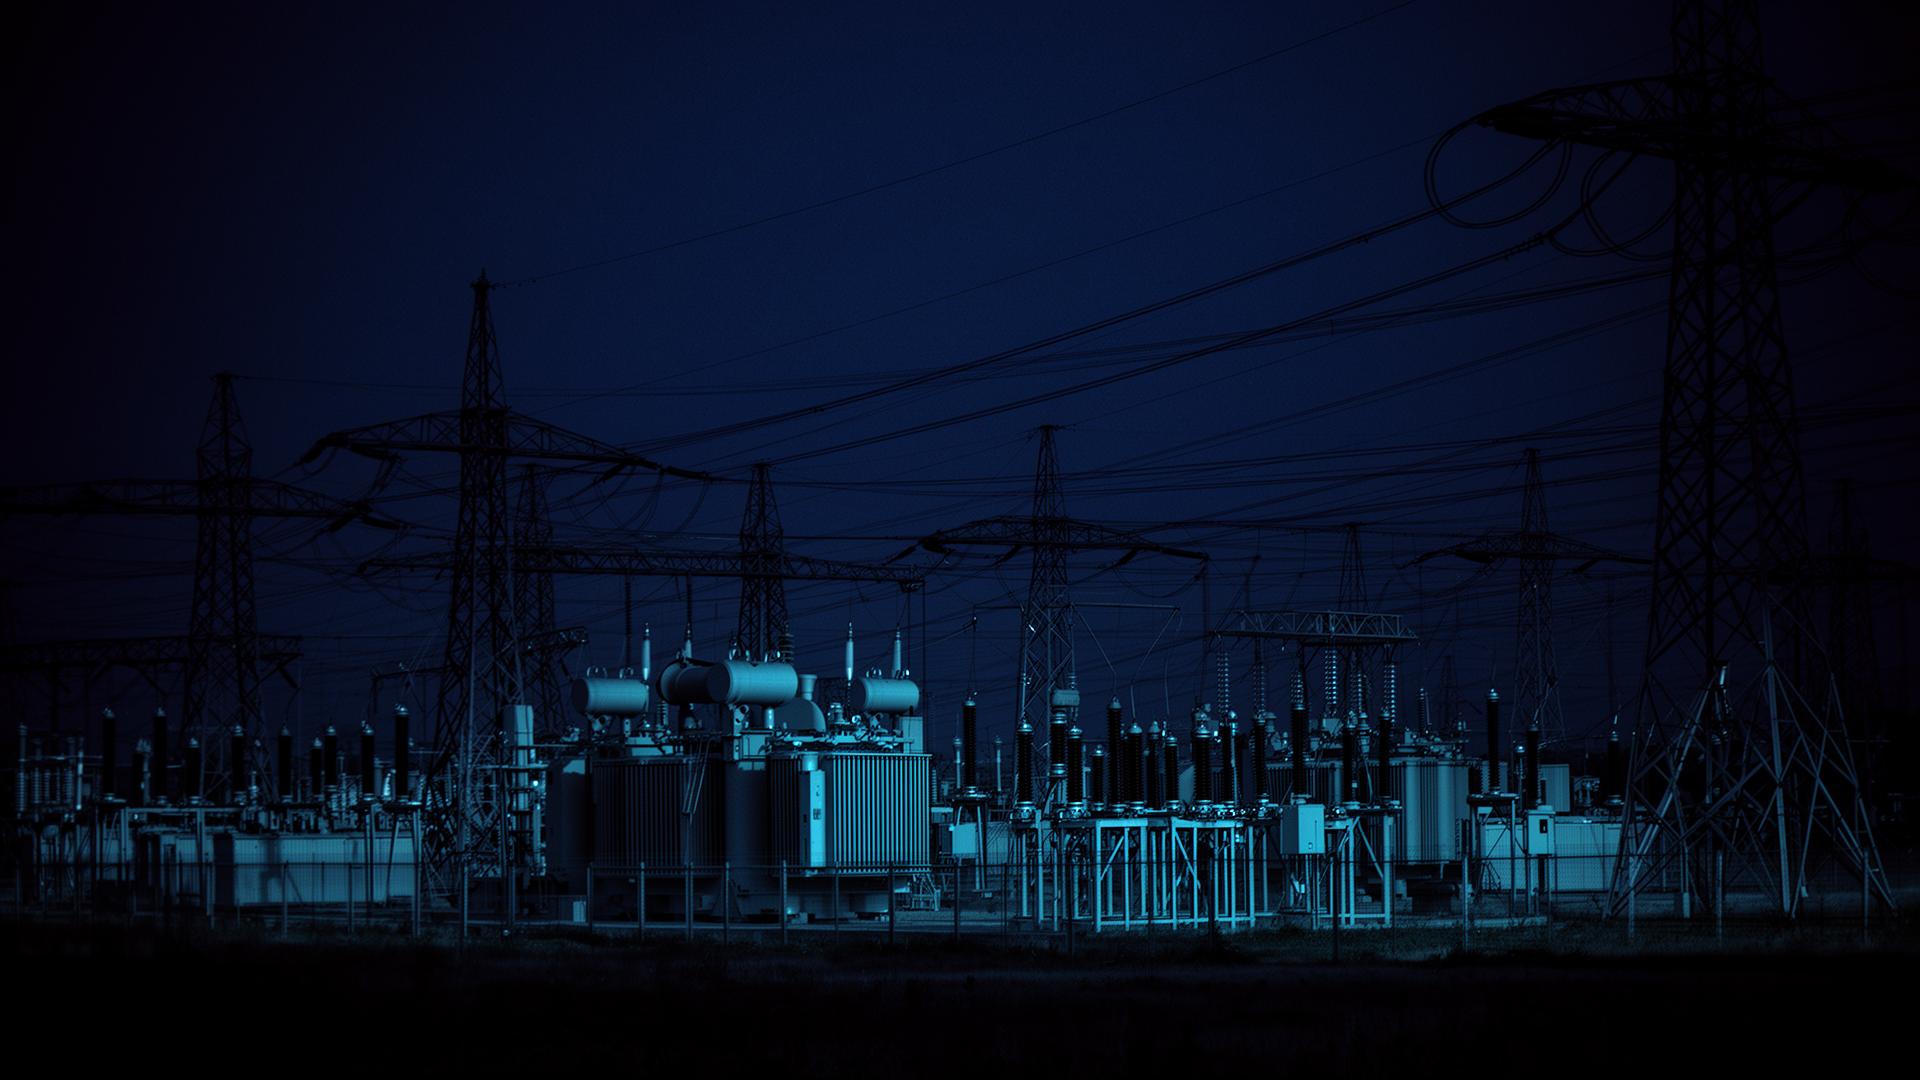
The electrical grid is hierarchically structured. At the top are high-voltage transmission lines — 115 kV, 230 kV, 345 kV, 500 kV, and above — that move bulk power between major substations. Below that are subtransmission systems, typically 26 kV to 69 kV, feeding local distribution substations. From there, primary distribution feeders at 4 kV to 35 kV extend through neighborhoods and commercial areas, ultimately stepping down through pad-mount or pole-mount transformers to the 120/240V secondary level that serves individual customers.
The distribution system — everything from the substation down to the meter — is where electricity becomes local. It is also where the physical constraints of electrification become most acute.
Distribution grid architecture
From 500 kV bulk transmission to 240 V residential service. Each tier has finite, hard-to-expand capacity — and electrification load terminates almost exclusively at the bottom three.
- Transmission115–500 kV
Bulk power between major substations.
- Industrial LoadsDistribution Substation26–69 kV → 12 kV
Step-down to primary distribution. Industrial loads ≥ 50 MW interconnect here.
- Congestion ZonePrimary Feeder4–35 kV
Backbone through neighborhoods and commercial corridors. Thermal-limited; congestion typically occurs here.
- Fleet & DCFCDistribution Transformer12 kV → 240 V
Pad- or pole-mount. Pulled into overload by 2–3 EV chargers per service group.
- EVs · Heat PumpsResidential / Commercial Service120 / 240 V
EV chargers, heat pumps, and panel upgrades land here.
A residential distribution feeder designed in the 1990s for a neighborhood of 300 homes was sized for that neighborhood's typical peak load at the time — roughly 1 to 1.5 kW per home, aggregated. Adding three electric vehicles per block charging simultaneously at 7 kW each, plus heat pumps replacing gas furnaces at 3 to 5 kW each, can double or triple the peak load on that feeder without any change in the number of customers it serves. The conductor, the transformer, and the protective equipment are all sized to the original design load. None of them automatically expand to accommodate the new one.
The constraints manifest in specific, physical ways:
Transformer overloads. Pole-mount distribution transformers are thermally rated. Sustained loading above nameplate degrades insulation, shortens service life, and ultimately causes failures. A transformer serving ten homes that previously loaded to 60 percent of nameplate can be pushed into overload by two or three EV chargers added to its service territory.
Feeder thermal limits. Distribution conductors have ampacity limits. Electrification load growth can push feeder loading toward thermal limits during peak periods, requiring load curtailment, conductor replacement, or feeder reconfiguration. Conductor replacement on an established route in a built environment is expensive and time-consuming.
Protection coordination failures. Distribution protection systems — fuses, reclosers, relays — are designed to provide selective fault isolation. When load levels change significantly and new distributed resources are added, protection coordination assumptions can break down. Recoordinating a modernized network requires detailed power flow modeling for every device on the circuit.
Substation capacity. Adding a new substation transformer involves equipment procurement with 18-to-36-month lead times, civil work, protection engineering, and commissioning. Siting a new substation in an urban or suburban environment adds permitting, environmental review, and community engagement to the schedule.
Same customers. Different infrastructure requirements.
A 1990s-era residential feeder modeled before and after moderate EV and heat-pump penetration. No new connections — just new load behind existing meters.
The point is not that these problems are unsolvable. They are all solvable, through established engineering methods and capital investment. The point is that they take time, money, and skilled labor — all of which are constrained.
Electric Vehicles: The First Wave
EV load growth is the leading edge of distribution stress because it is already happening at scale in high-adoption regions, and because EV charging behavior creates load profiles that the distribution system was not designed for.
Residential EV charging is manageable in low-density adoption scenarios. A single Level 2 charger at 7 kW on a 200-amp service typically fits within the panel rating. The transformer may have headroom. The feeder may tolerate additional load. In practice, utilities in California, Oregon, and parts of the Northeast are finding that adoption is not uniform — it clusters geographically in higher-income neighborhoods and in regions with strong incentive programs, creating localized infrastructure stress rather than evenly distributed load growth.
Fleet and depot charging is a different infrastructure category. An electric transit agency charging 80 buses overnight at 60 to 150 kW per charger requires 5 to 12 MW of distribution interconnection at a single point. The utility must serve this load from the nearest substation with available capacity, run new primary feeder, install switchgear and metering, and coordinate protection — a one-to-three-year process from application to energization. Operators discovering this timeline after committing to fleet electrification targets are finding the gap between ambition and infrastructure realities uncomfortable.
Fast charging corridors — the DC fast chargers along highway routes that enable long-distance EV travel — have their own interconnection requirements. A four-stall 350 kW DCFC installation requires approximately 1 to 1.5 MW of utility service. In rural areas, this can require extending primary distribution infrastructure miles to the nearest available capacity — a project that may cost more than the charging equipment itself.
EV charging load curve: managed vs. unmanaged
Aggregate fleet charging demand over a 24-hour cycle, MW. Unmanaged charging stacks directly onto the evening peak; managed charging shifts load to overnight hours.
Managed charging — software-coordinated load control that shifts EV charging to off-peak hours — is the primary near-term mitigation tool utilities are deploying. Demand response programs, time-of-use rates, and direct load control agreements with fleet operators can meaningfully reduce coincident peak demand. But managed charging requires customer participation, software infrastructure, communication systems, and utility SCADA integration. It is a useful tool, not a complete solution.
Heat Pumps and the Winter Peak Problem
Heat pump electrification presents a specific challenge to utilities whose grid infrastructure was sized around summer cooling peaks.
Most U.S. utilities in warm and moderate climates designed their systems around air conditioning load. Summer afternoons, when commercial and residential cooling runs simultaneously, define the annual peak demand that determines transformer sizing, feeder capacity, and substation nameplate ratings.
In temperate climates, electric resistance heating has historically been a small fraction of the heating fuel mix. Most homes use natural gas or fuel oil. Winter electrical peaks, while real, were substantially lower than summer peaks in most service territories outside the Deep South.
Heat pump adoption changes this. A modern cold-climate heat pump running at rated capacity in a sub-zero outdoor temperature can draw 3 to 5 kW of electrical demand. At temperatures below its balance point — typically -10°C to -15°C — the heat pump relies on resistance backup heating that draws 5 to 10 kW or more. A neighborhood of 200 homes replacing gas furnaces with heat pumps creates a new winter peak load that the distribution system may have never been asked to carry.
Winter vs. summer peak: the crossover
Representative northeastern utility annual peak demand, MW. Heating electrification projects winter peak above historic summer peak by the early 2030s.
This is not a reason to oppose heating electrification. It is a reason to plan for it systematically, starting with distribution capacity analysis, feeder upgrade programs, and transformer assessments calibrated to realistic electrification scenarios.
Industrial Electrification at Scale
The electrification of industrial processes is the least visible but potentially the most consequential load growth driver for the transmission-distribution interface.
Industry uses roughly one-third of all energy consumed in the United States. The majority of that energy goes to process heat — temperatures from 100°C for food processing to 1,600°C for steel and glass production. Process heat has historically been supplied almost exclusively by combustion: natural gas, fuel oil, coal, and industrial gases. The electrical grid played a limited role.
Induction heating, electric arc furnaces, plasma torches, and resistance heating are mature technologies capable of supplying high-temperature process heat from electricity. As natural gas prices became more volatile and electrification technology costs improved, the economic calculus for industrial electrification shifted. The CHIPS Act, the IRA's manufacturing credits, and the reshoring of semiconductor, battery, and advanced manufacturing capacity are accelerating this shift by creating new facilities that are being designed for electrical processes from the outset.
A modern semiconductor fabrication plant is among the most electricity-intensive industrial facilities ever built. A leading-edge fab can require 100 to 300 MW of continuous, high-reliability power. A new EV battery gigafactory requires comparable capacity. These are not distribution events — they require transmission-level interconnection and dedicated substation infrastructure. But they are competing for the same transformer supply, the same engineering labor, and the same interconnection queue positions as distribution upgrades, BESS projects, and renewable generation.
The clustering of industrial load creates regional grid stress that requires coordinated transmission and distribution planning at a scale utilities have not historically needed to execute. A new industrial corridor in a historically light-industrial region — a semiconductor cluster in Arizona, an EV manufacturing complex in Tennessee — can require simultaneous transmission expansion, new substation construction, and distribution feeder upgrades across a regional grid that was not sized for that concentration.
The Physical Hardware the Era Requires
Strip away the policy arguments, the adoption curves, and the technology forecasts, and what remains is concrete and physical: the electrification era requires an enormous volume of grid hardware.
More conductors. Distribution feeders must be replaced or augmented with larger conductor sizes to handle higher ampacity requirements. Underground feeders in urban areas must be re-pulled through existing ductbanks, or new ductbanks must be bored or trenched. Overhead lines must be reconductored with higher-rated wire.
More transformers. Every point of new load requires a transformer to step voltage down to the service level. Pad-mount transformers for commercial and industrial services, pole-mount transformers for residential distribution, and substation power transformers for major load growth events are all required in vastly greater quantities than utilities have historically procured. Lead times have stretched from 12 to 18 months under normal conditions to 24 to 36 months in the current supply-constrained environment. Large power transformers for substation expansion carry quotes beyond three years from some manufacturers.
Transformer lead times: 2019 vs. 2022 vs. 2024
Procurement lead time in months across distribution and bulk power equipment categories. Supply-chain compression of 2021–22 has not normalized.
More substations. Load growth that exhausts substation capacity requires either transformer additions within existing substations or new substation construction. New substation construction in developed areas takes three to seven years from initial planning to energization.
More switchgear and protection equipment. Modern distribution automation requires updated switchgear that can be remotely operated and reconfigured, reclosers with programmable relay coordination, and advanced metering infrastructure that communicates bidirectionally with utility control systems.
More SCADA and grid software. Visibility into distribution system state — what loads are connected, what voltages are present, what transformers are loaded to what level — is increasingly essential for utilities managing dynamic load profiles from EVs and heat pumps. Legacy SCADA systems designed for periodic data collection cannot provide the real-time visibility that electrification-driven load management requires.
Every one of these components requires procurement, skilled installation labor, utility engineering review, regulatory approval, and commissioning. None of them appear overnight.
Utility capex expansion
Aggregate U.S. investor-owned utility capital expenditure, $ billions. The post-2022 inflection reflects load forecast revisions and IRA-era infrastructure programs.
Why Utilities Are Struggling to Keep Up
Utilities are not resisting electrification because they oppose it. Most utility management teams understand that electrification is an economic opportunity — new load is revenue. The constraint is not motivation. It is execution capacity.
Distribution engineering departments were sized for a slow-growth era. Many utilities reduced engineering headcount during the flat-demand decades, outsourcing more work to contractors and cutting internal planning capacity. The engineering expertise required for rapid distribution expansion — power flow analysis, protection coordination, substation design, feeder reconfiguration — is not quickly rebuilt when the planning environment changes.
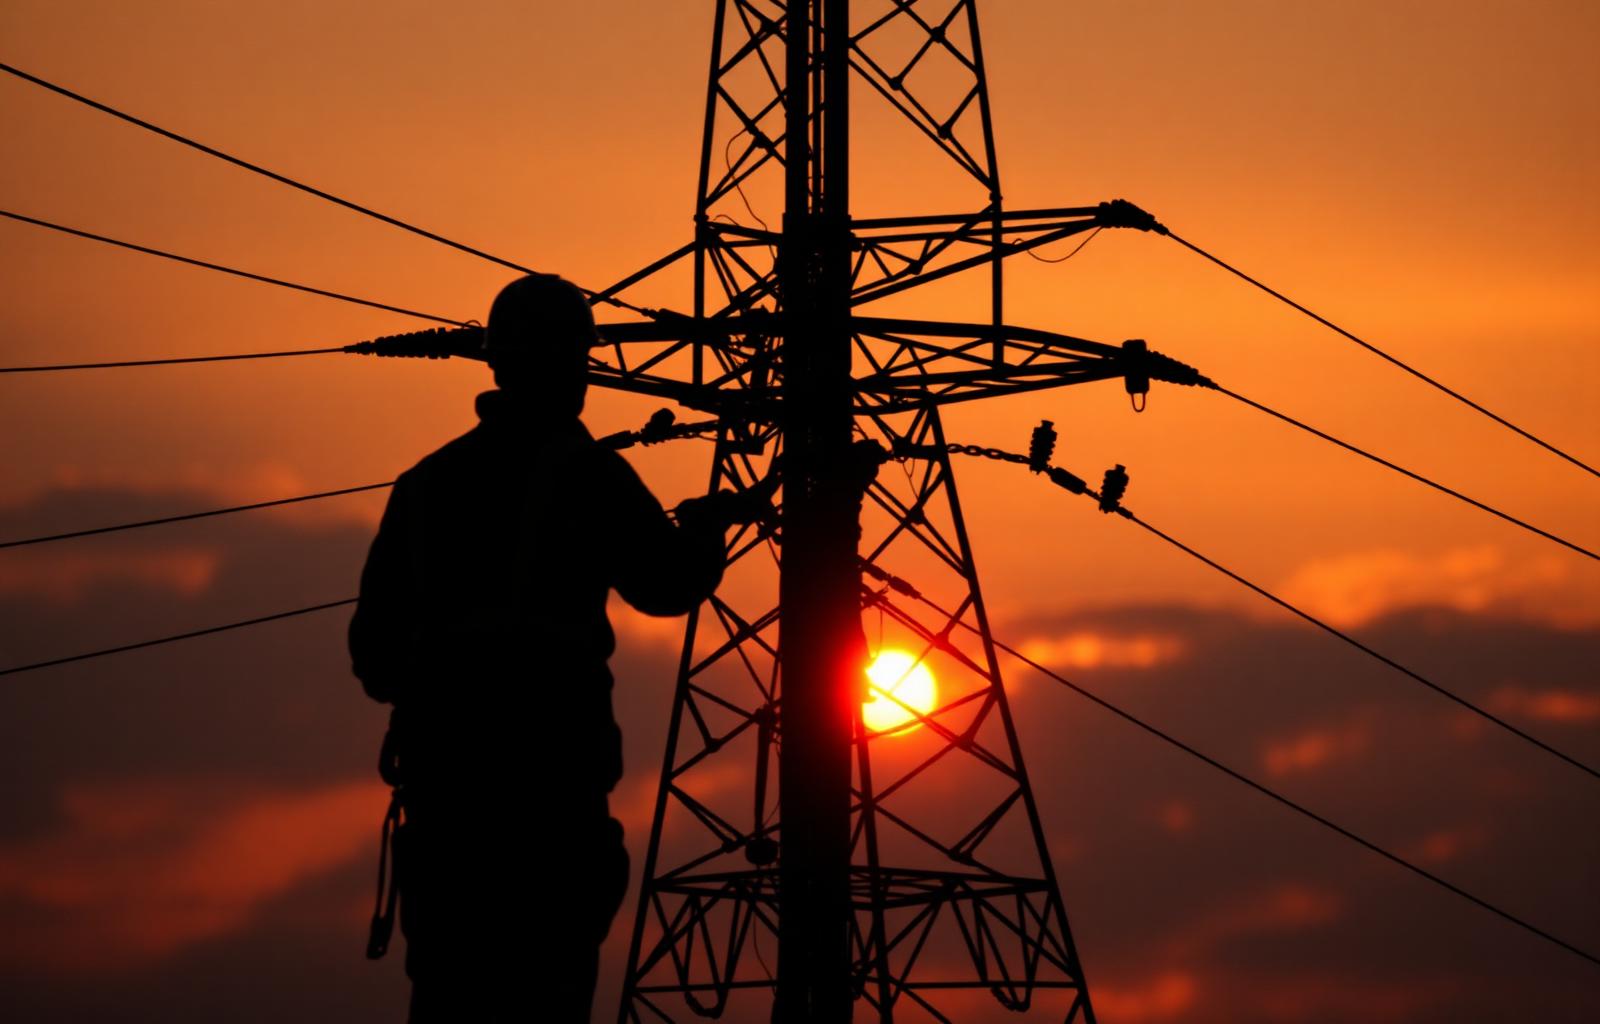
The craft labor shortage is acute. Journeyman lineworkers, substation electricians, cable splicers, and protection technicians are in short supply across most utility service territories. Apprenticeship programs take three to five years to produce qualified journeymen. The workforce that built the existing distribution system is aging; the pipeline of replacements is insufficient for a rapid expansion cycle.
Regulatory lag compounds the problem. Utility capital expenditures require regulatory approval through rate case proceedings that can take one to two years to complete. A utility that identifies a distribution upgrade program needed in 2024 may not have regulatory approval to recover the capital cost until 2026 or 2027. The asset may not be energized until 2028.
Transformer procurement is a chokepoint that affects every other timeline. Every distribution upgrade that requires new transformer equipment is constrained by the same supply chain limitation affecting bulk power transformers. The program timeline cannot compress faster than the hardware supply chain allows.
The Strategic Importance of Distribution Utilities
The distribution utility was, for most of the twentieth century, among the least strategically interesting infrastructure operators in the economy. It maintained poles and wires, replaced failed transformers, and restored outages. Its capital programs were incremental. Its planning horizons were comfortable. Its strategic relevance was modest.
That description is becoming obsolete.
The distribution grid is now the physical delivery mechanism for the most consequential economic transition of the industrial era. The competitiveness of electrified manufacturing depends on whether adequate power can be delivered to industrial sites. The practicality of fleet electrification depends on whether distribution infrastructure can support depot charging. The reliability of AI infrastructure depends on whether substations serving data centers can be expanded on timelines that match development schedules.
“Local grid capacity is becoming economic infrastructure in the same way that highway access, rail connections, and port proximity have historically defined regional economic geography.”
Industrial companies evaluating site selection for new manufacturing facilities are now explicitly assessing available utility capacity — the megawatts a substation can deliver, the timeline for interconnection, the reliability history of the local distribution system. Utilities that invest in distribution modernization and maintain the capacity to execute large capital programs quickly are becoming competitive advantages for their service territories. Those that cannot expand fast enough are becoming economic constraints.
The Bigger Picture
The electrification era is not simply replacing gasoline with electrons or natural gas with heat pumps. It is physically reconstructing the infrastructure through which energy is delivered to civilization.
For the past century, energy delivery was dual-tracked: electricity for certain applications, combustion fuels for others. The two systems ran in parallel, each with its own infrastructure — electric wires and gas pipelines coexisting in every neighborhood and industrial complex. The electrification era is progressively collapsing this parallel structure toward a single delivery system: the electrical grid.
That collapse requires the electrical delivery system to carry load it was never sized for, at geographic locations it never reached, with reliability standards it was not originally designed to meet. The poles, wires, transformers, substations, protection systems, and metering infrastructure of the distribution grid must be expanded, modernized, and in some cases fundamentally redesigned to absorb this transition.
Most of the electrification load growth that has been widely forecasted has not yet arrived. EV adoption is early in the adoption curve. Heating electrification is just beginning in most northern markets. Industrial electrification is at demonstration-scale in most sectors. AI data center buildout is accelerating but still in its early years of grid impact.
The distribution system that must absorb all of this is the same one that was sized for a low-growth, dual-fuel economy a generation ago.
Conclusion
The electrification era is still early, and that is precisely what makes it consequential for infrastructure planning.
The load growth that has already arrived — visible in utility capex programs, transformer procurement queues, interconnection backlogs, and distribution feeder overloads — represents a fraction of what is projected by mid-decade and a small fraction of what the end state of economy-wide electrification would require.
The real constraint on the electrification transition is not the availability of electric vehicles, heat pumps, or industrial electrification technology. The supply chains for those products are constrained but functional. The constraint is the physical grid infrastructure required to deliver the electricity those products need: the transformers, feeders, substations, conductors, switchgear, and protection systems that constitute the distribution system.
Building that infrastructure is not difficult in principle. It is difficult in practice, because it requires capital, labor, time, regulatory approval, equipment supply, and engineering capacity — all of which are currently insufficient for the pace the electrification transition demands.
The energy transition is, at its foundation, an infrastructure construction cycle.
The generation technology is largely ready. The storage technology is scaling. The end-use applications are increasingly cost-competitive. The distribution grid is the pacing constraint — the physical system that must expand faster than it has in half a century to deliver the electrons that an electrifying economy now requires.
That constraint is manageable. It is also the defining infrastructure challenge of the next two decades.
Continue reading.
The Earth Receives 173,000 Terawatts of Solar Energy
The bottleneck has never been the fuel. It's always been the infrastructure.
Inside the Interconnection Queue Crisis
2,600 GW waiting to plug in. Hyperscale load is pulling forward a transmission problem.
Battery Storage Is Becoming Grid Infrastructure
From peakers to firming: 4-hour and 8-hour BESS reshape capacity and ancillaries.
HVDC Corridors and the Stranded-Renewables Problem
Wind in the plains, solar in the desert, load on the coasts. Long-distance wires are the bottleneck.